

|
| Index & Notes |
|
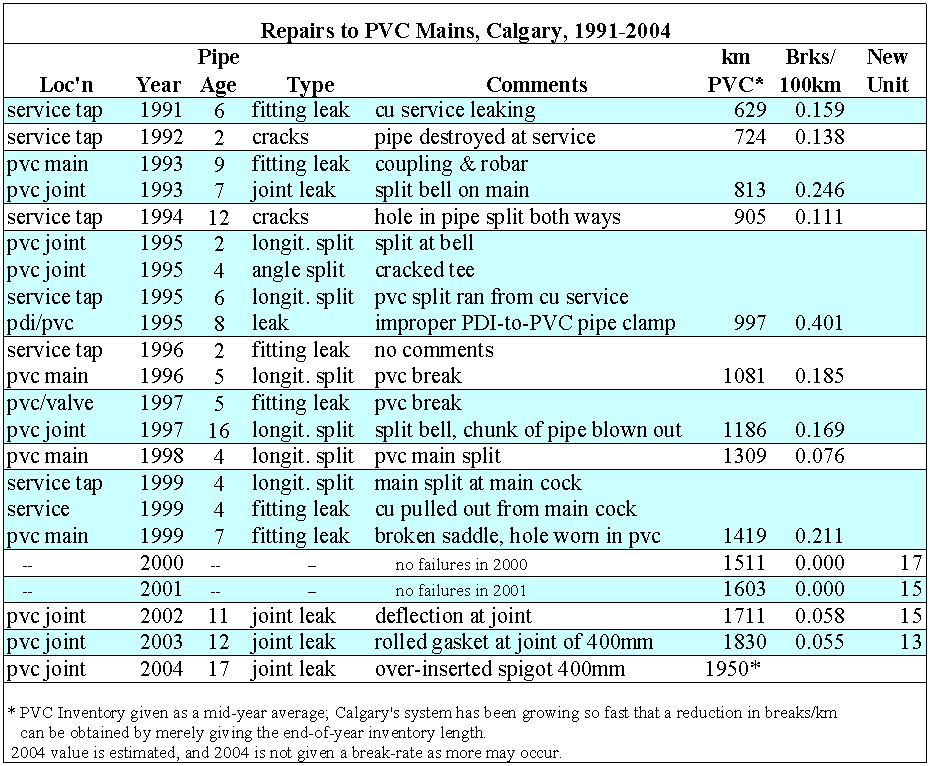
PVC Break slide.
With metallic pipes, I'm used to treating breaks statistically. With my PVC system, the breaks are individuals, with names. We have had only twenty breaks in the last fourteen years, all of them shown here.
I have alternated blue and white backgrounds each year, with the year shown at left. You can see the good and bad years, such as the horrors of 1995 when we had four breaks, nearly 1% as many as on metallic. But for 2000 and 2001, there's just a note saying "no breaks".
Dividing each year's break-count by the number of hundreds of kilometres of PVC for that year, you see why I don't even try to show our PVC break-rate on that previous graph with the other materials. The rate is so low, you couldn't tell the line apart from the X-axis.
With metallic breaks, there are enough to speak of statistical averages; with PVC, an extra break or two can triple your average for a year, creating a wildly varying graph.
So, in my paper, I propose a new unit for measuring pipe failure rates that accomodates plastic materials, which I have put in the last column on the right. It is repairs per thousand kilometres, per decade, and is based on a 10 year moving average, rather than any one year's value.
I'd love to name this unit after the Chief Engineer of the Calgary Waterworks in the 1970's, who became our director and my first boss, Jim Bouck. Jim was the guy who got the yellow-jacket company to adapt their product to bell & spigot pipe, cutting breaks by an order of magnitude; then he championed our switch to PVC as soon as the C900 spec came out, cutting them a second order of magnitude. That's quite an achievement for one career.
Using that name, Calgary's current PVC failure rate is trending downward from 17 to 13 boucks. Our YDI break rate is rising from 300 to 350 boucks recently, and our DI failure rate is holding steady at about 3 kiloboucks.
In a 1992 report, several Canadian cities that we can be usefully compared to, had failure rates for PVC between 0.7 and 0.9 breaks/100km/year, or 70 to 90 boucks, as I would call it. Our failure rate is less than a quarter of that, and still dropping. The heart of my paper proposes a theory explaining this.
It comes from what you must note about the cause of every failure we have had. In all of them, the problem can be traced to a error of installation.
Every single one.
They were all preventable, if only construction practices could be perfect.
© Roy Brander, P.Eng 2003