

|
| Index & Notes |
|
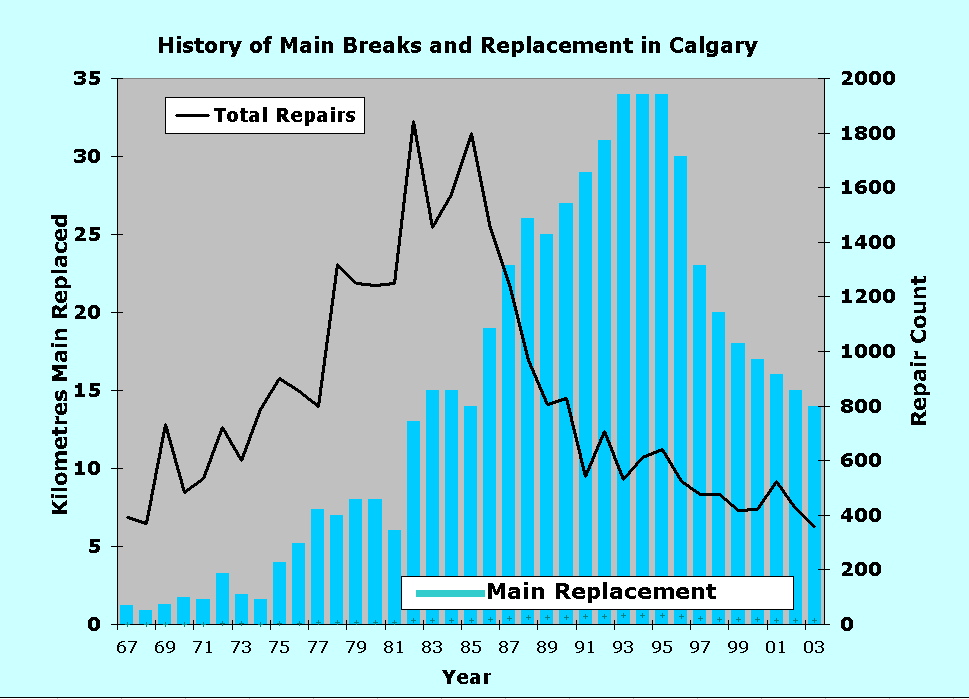
History of replacement graph
The financial crisis this caused profoundly affected the history of our waterworks for this last 30 years. This black line on this graph, against the Y-axis on the right, shows the number of mains repairs we have had each year since the late 1960's. Since each repair needs a 3m deep hole in the ground, each costs a day or more of service and about 5000 Euros...several million Euros per year at the peak of 1800 in the 1980's.
The blue bars show the amount of main replacement we did in kilometers against the left Y-axis. If you multiply this 35km peak by the current figure of 450000 Euros per kilometer, you see it was over 10 million Euros per year. At those prices, we definitely weren't going to put in main that was going to die in 10 or even 30 years, we had to find something better. Since we did, and since we replaced the ductile iron with pipe that didn't corrode, the breaks have gone back down into the 400's and we've steadily reduced the replacement program.
© Roy Brander, P.Eng 2003